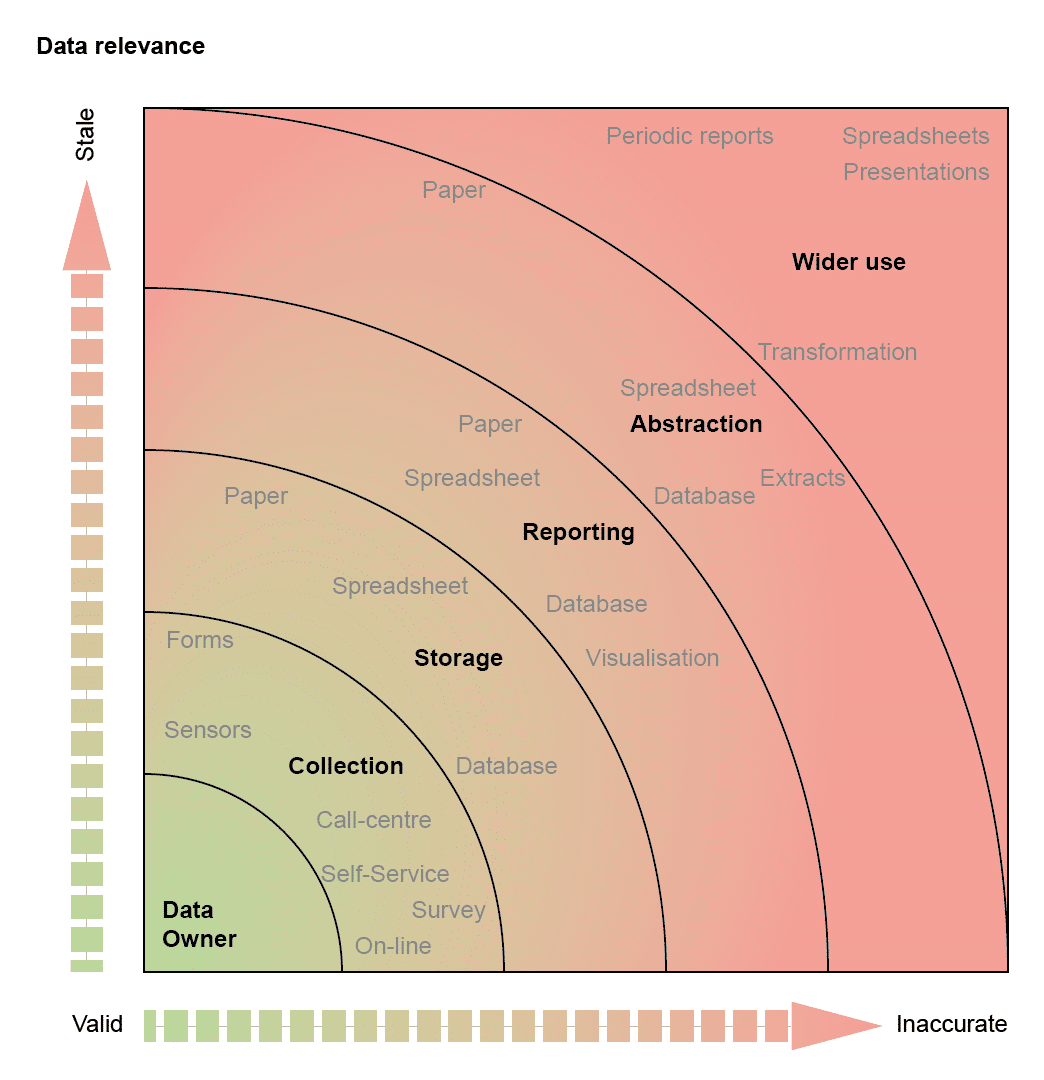
Data comes in many shapes and forms although it always has to originate somewhere: a data owner. In most business environments, the data owner is a real entity – a person, another company, or a sensor attached to a thing.
Data suffers from a problem though – the moment it leaves its owner, it loses relevance; either it becomes either stale or, through business processes and abstraction, more inaccurate.
We often meet customers that use a plethora of tools to extract and manipulate data – typically to produce management reports. These then become subjected to more and more abstraction until the data provides a single statement: “We’re OK”, or “We have a problem”. The question remains though, how much do you trust the information generated from your data?
By taking a journey through a typical data life-cycle, we can explore the issues and management techniques required to ensure you have trusted data when you need it.
Collection often brings its own problems. If you use a survey, how do you know whether your subjects ‘invented’ the answers given? It’s common for people to give false data when surveyed[1], sometimes with huge variances depending on reward, length of survey or knowledge required. Research also suggests that people will give different answers to the same questions when surveyed again.
You don’t get away from collection errors in the “Internet of Things” world either: a sensor can provide rogue results – perhaps due to a network error, temporary fault, or low-battery. With poor security models in play users or malicious third parties can tamper with results, suggesting a need to encrypt and hash data before transporting it.
If it’s important enough, people will provide accurate data. Few people, for example, would provide an incorrect delivery address when ordering something of value.
Desktop and mobile applications provide an additional channel for users to maintain their own information and, if the service has a good user-interface, people will update information when needed. However, users rarely delve into service settings to update information without good cause – so the application developers need to address relevance of data along with the amount of time that has elapsed since it was last verified.
So, we have a variable quality factor to consider when collecting data, but collection only kick-starts the real problem: how do you store, process and report on your data?
Storage can introduce unexpected problems: what if a database defines a field as an integer when we want to use a floating-point data point? What if we have a country or region that the system doesn’t support out of the box? What if specialist terms or names have different meanings in different contexts or dialects? You may have stored the information correctly in terms of syntax and structure, but restrictions within poor storage start to introduce minor errors or inconsistencies that later processes will compound and amplify.
We then report on the information stored. Of course, data was stored at a given point in time. A reporting process extracts, transforms, and presents data, adding another point-in-time copy of the information collected. Excel often becomes the management tool of choice, despite it becoming a burden when data needs to be refreshed. Information within a report is naturally stale by this point, even more so if it relies on multiple spreadsheets, each copying data at a specific point-in-time. Processes to sort or transform information into the appropriate format for subsequent presentation often involve the collection of data from numerous sources, sorting or processing the data, and so on. Errors creep in at this stage – on top of any issues, inaccuracies, or misplaced confidence in the quality of base data.
The problem with reports is that they often form the basis of higher-level reports. This means that we have to abstract data from lower-level reports to provide this abstraction – and this eats time. Again, many people fall back to inappropriate data management tools such as Excel. It’s not uncommon to see people creating a set of graphs in Excel on a weekly basis – the report manufacture costing several hours per week. Companies often miss this point when developing systems – it’s often cheaper to create a proper report from a system than allow users free-access to extract copies from it, then manipulate it.
We then release reports and data into the wider world. At this point, we have subjected it to transformations, re-calculations, abstraction, translation and many other processes. For most published data, the results have already expired and represent only a single point in time. You can only rely on data if you trust the manner in which it was collected and processed. In many cases, it proves extremely difficult to demonstrate causality from data, without understanding the full lifecycle.
There are, however, ways to mitigate against many of these issues:
- Keep as close to the original source as possible
- Keep integrations extremely simple and flexible
- Maintain as few copies as you need, and work to remove any processes using these copies (if you can use the original source in place of a copy, do so)
- Avoid giving blanket access to extracts from source data where possible
- Keep transformations to a minimum – each transform will bring in sample errors and introduces another opportunity for information to become stale
- Visualise and report on live data wherever possible, and always timestamp results
- Document all processes fully
- Use the right tool for visualisation
- Remove stale data
- Use the right tools for the job
We spend a lot of time getting data right. We get as close to the original source as we can, and then use live connectors to provide interfaces to visualisation or reporting tools. Wherever possible, we avoid spreadsheets. These simple rules let us improve data control and reporting, increase productivity, and reduce the reliance on stale data, risk, and costs.
At Capventis, we developed a data integration framework to pull all of these elements together. It allows us to use data from multiple systems in real-time, or as part of a scheduled activity. The framework handles data integration, audit, reporting and governance from within a single tier – massively simplifying data management. This approach also removes the need to maintain multiple copies of data or trawl through numerous spreadsheets every week!
When dealing with a lot of data from many sources and in many different sources, it pays to define your data management processes properly. If you need a hand, we’re here to help.